Introduction
The most basic way to describe the UNFCCC Common Reporting Format
(CRF) is to call it the standardized database companion to the National
Inventory Report (NIR). The NIR can be considered the user manual
for a Party’s emissions data. The CRF contains the numbers,
while the NIR describes how those numbers were produced.
The most important characteristic of the CRF is indicated by the
first word in its name: “Common.” The CRF ensures that
there is one standardized reporting format (including consistent
categories and definitions) that all Parties use. Without the CRF
it would be almost impossible to compare emissions from
Parties except at a national aggregate level.
The CRF includes 53 separate tables (some tables are broken up
into multiple sheets because of their size). Each set of CRF tables
includes data for one inventory reporting year (except for Table
10 on Emission Trends). In addition, Parties normally submit a set
of tables for each reporting year (e.g., 1990 to 2007). Therefore
a complete CRF submission in 2008 for a Party may include up to
901 tables (53 tables times 17 years).
Like their simpler predecessor, the IPCC Reporting tables, the
CRF include data on all IPCC sectors in addition to a number of
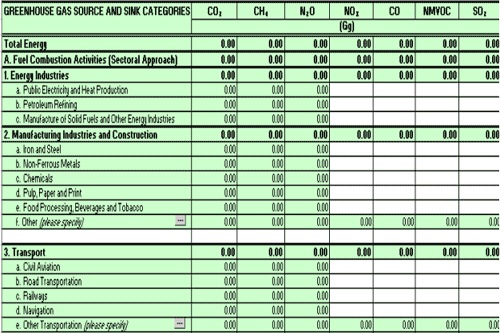
summary tables. The source and sink definitions are based upon the
IPCC categorization scheme, which is also used to number scheme
from the IPCC (i.e., the Energy Sector Table in Figure 2).
|
