| 7 of 10 |
|
|||||||||||
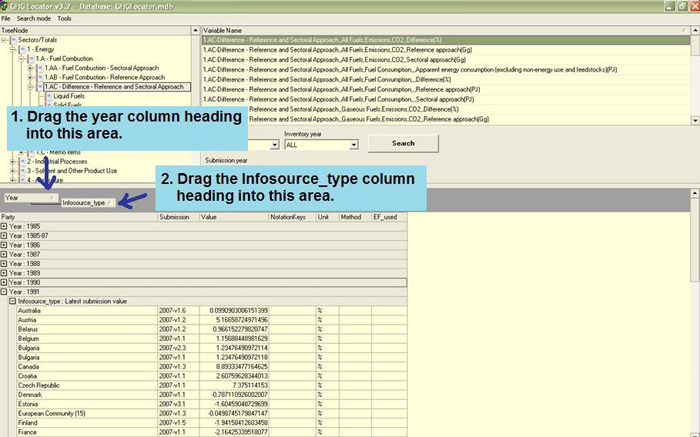
STEPS TO FOLLOW:
Once the data are on your screen, you can manipulate them for easier
viewing. The first step is to click and drag the year column heading into
the bar area above the table. This will organize the data by year. You
can then repeat the procedure with the "infosource_type" column heading,
creating a second level hierarchy in the organization so you can focus
only on the latest submission values. Now you can view data across Parties
for a single year. |
|||||||||||