5.3. Comparison of CO2 emissions from fuel combustion
(Table 1.A(c) – sheet 1)
Table 1.A(c)
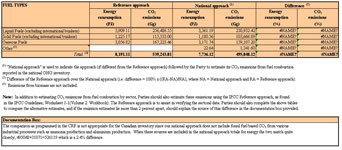
This table provides a comparison between a Party’s
Reference Approach and Sectoral Approach calculations for
aggregate apparent energy consumption of major fuel types
(i.e., solid, liquid, and gaseous), and other fuels and CO2
emissions. This comparison is to assist in verifying the
sectoral data and identify potential inconsistencies in the
calculations.
For the purposes of comparing apparent energy consumption from the Reference approach with energy consumption from the Sectoral approach, a column is included in this table with the energy content corresponding to the fuel quantities used as feedstocks and/or for non-energy purposes subtracted from apparent consumption. Because most of the carbon in feedstocks and non-energy use fuels will not be emitted (or the emissions will be accounted for in the Industrial Processes sector), subtracting it from apparent consumption gives a more accurate basis for comparison.
This table also includes a documentation box stating that
the
Parties should explain differences between CO2 emissions
calculated using the Reference Approach and the Sectoral
Approach. Specifically, Parties should provide an
explanation when the difference exceeds 2 percent and refer
to the chapter of their National Inventory Report (NIR) where
this difference is explained in more detail.
5.4. Sectoral background data for energy (Table 1.A(d)
– sheet 1) – Feedstock and non-energy use of fuels
Table 1.A(d)
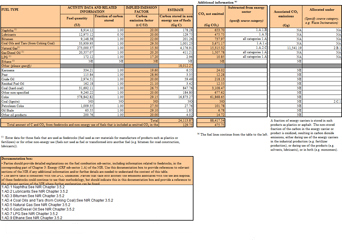
This table provides information on fuel quantities (TJ) that
are utilized as feedstocks (i.e., fuels used as raw materials
for production of materials such as plastics or fertilizers) or for non-energy uses (e.g.,
bitumen and lubricants).
The table also includes a column with implied factors for
carbon emitted (t C/TJ) for each fuel type, as well as estimates
of the quantity of carbon stored (Gg C).
Additional tables show the amount of CO2 not emitted because it was stored in products, and the CO2 emissions associated with feedstock and non-energy uses. Each table also has a column to indicate where this carbon was allocated in the inventory. |